
Cross-Border E-Commerce Giants: Half Profitable, Half Bleeding?

By Wang Yu | Edited by He Yang
[Ebrun Original] With over half of 2026 already behind us, cross-border e-commerce has emerged from the "main tremor" of last year only to face relentless "aftershocks." The industry is navigating a series of recalibrations in search of a new course. Just as the US tariff turmoil subsided, the EU introduced a fresh round of tariff and regulatory adjustments; AI technology has evolved from a novel concept to a highly ubiquitous productivity tool; developed markets are accelerating the phasing out of outdated playbooks, while emerging markets are opening their arms to absorb incremental growth. For cross-border enterprises, this is undeniably a period of volatility. As the industry's most representative leaders, the moves of cross-border e-commerce giants reflect the strategic judgments of the top-tier operators shaping the sector's future. Their half-year reports also serve as the best window into the industry's health. Peeling back the veneer of "optimistic expectations," beneath the surface of revenue growth and aggressive stockpiling, how many companies are actually turning real profits from the market? How many can navigate cycles and sustain long-term performance? And how many are barely holding on, suffering "internal injuries" amid frequent shocks? To answer this, Ebrun has compiled a list of 27 representative listed companies from the cross-border e-commerce sector, covering multiple product categories and including both brand-oriented and volume-based sellers, aiming to gauge the true quality of industry growth through financial data.

Revenue and Profit Disconnect? Some Make Money, Others Just Make Noise
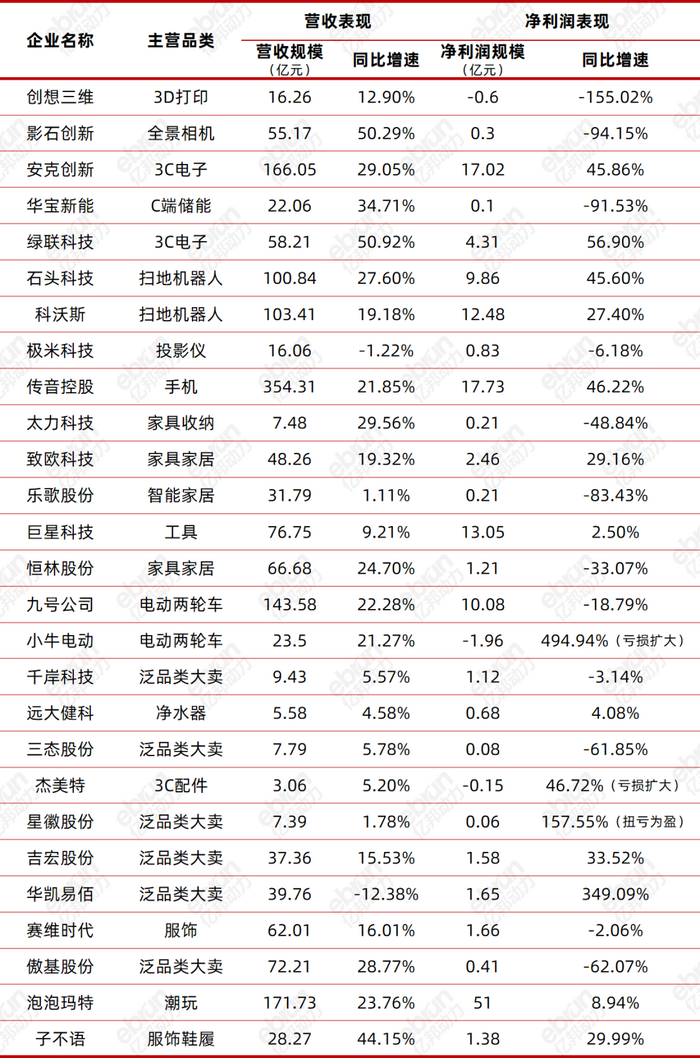
Looking at the financial data, the keyword for the first half of the year is "disconnect"—being able to sell products doesn't equate to being able to profit.
On the revenue front, of the 27 companies, as many as 18 maintained year-on-year growth of over 10%, with only two reporting negative growth; among them, industry leaders like Insta360, Ugreen, and Subuyy saw increases of 40%–50%. However, shifting focus to the profit side, 14 companies experienced negative profit growth or even losses, with only 10 achieving growth exceeding 10%.
Overall, 12 companies saw simultaneous positive growth in both revenue and profit, less than half; the more common scenario was revenue growth without profit growth, or only marginal profit increases.
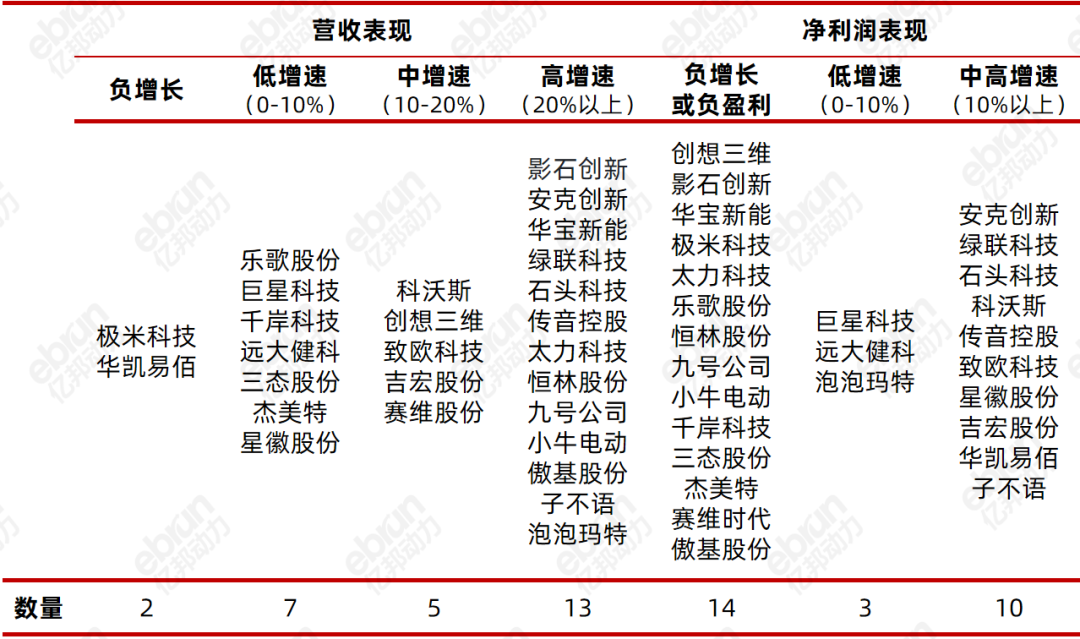
Specifically, these companies can be broadly categorized into three typical profiles.
The first category includes companies with low revenue growth but strong profit performance, achieving "real gains and quiet profits" through bold strategic contraction.
Hua Kai Yi Bai is a prime example. On paper, it posted the largest revenue decline in the industry for the first half, yet its 350% profit surge topped the charts—a successful "self-rescue" by a veteran general-merchandise seller. Behind this contrast lies its proactive approach to trimming "unprofitable turnover." During the period, the company significantly scaled back its business on value-for-money platforms like Temu, sharply compressed its general merchandise operations, with revenue falling 19.24% year-on-year, and delisted numerous low-efficiency SKUs. Concurrently, it doubled down on its premium business, achieving revenue of 996 million yuan, up 11.56% year-on-year, with an average order value of 307 yuan—2.7 times that of its general merchandise.
The second category comprises companies with surging revenue but significant profit pressure.
This camp includes several familiar category leaders. For instance, Insta360 saw first-half revenue growth exceed 50%, but net profit shrank by over 90%. The reasons are twofold: first, continued price increases in raw materials like memory chips; second, the new panoramic drone business is still in its investment phase, with R&D, production line construction, and channel expansion requiring substantial capital, dragging down overall profitability.
Creality, in the 3D printing space, faces similar pressures. Price hikes for multiple key components have raised costs; currency fluctuations further eroded profits, with exchange gains alone down nearly 50 million yuan compared to the same period last year. Meanwhile, intense price competition with Bambu Lab has further squeezed profit margins.
In the electric two-wheeler segment, Ninebot reported exchange losses of 371 million yuan in the first half, compared to exchange gains of 257 million yuan in the same period last year; additionally, due to concentrated product iterations, its electric two-wheeler gross margin fell to a yearly low. Niu Technologies continued to bleed with no clear stopping point, posting a net loss of 196 million yuan in the first half—already far exceeding last year's full-year loss—and overseas sales also declined 10.6% year-on-year.
The third category includes companies with strong performance in both revenue and profit, representing true long-term stability and steady growth.
Anker Innovations, Ugreen, and Transsion Holdings are representatives. Beyond temporary tailwinds like tariff refunds, offline channel expansion, and inventory and raw material value appreciation, these three share a notable commonality: their innovative businesses have entered a phase of volume scaling, contributing a second growth curve.
For example, Anker's UV printers, lawn mowers, and solar-plus-storage products are scaling up and capturing significant market share in niches; Ugreen's NAS business saw revenue surge 85% year-on-year, solidifying its position among the global consumer NAS leaders; Transsion is accelerating its energy storage business in South Asia, the Middle East, and Africa, achieving 950 million yuan in revenue in just three years, with a compound annual growth rate of approximately 825.58%.

The "Bleeding" Problem Becomes Widespread: Inventory Surge Carries Mixed Signals
Scroll for the full article
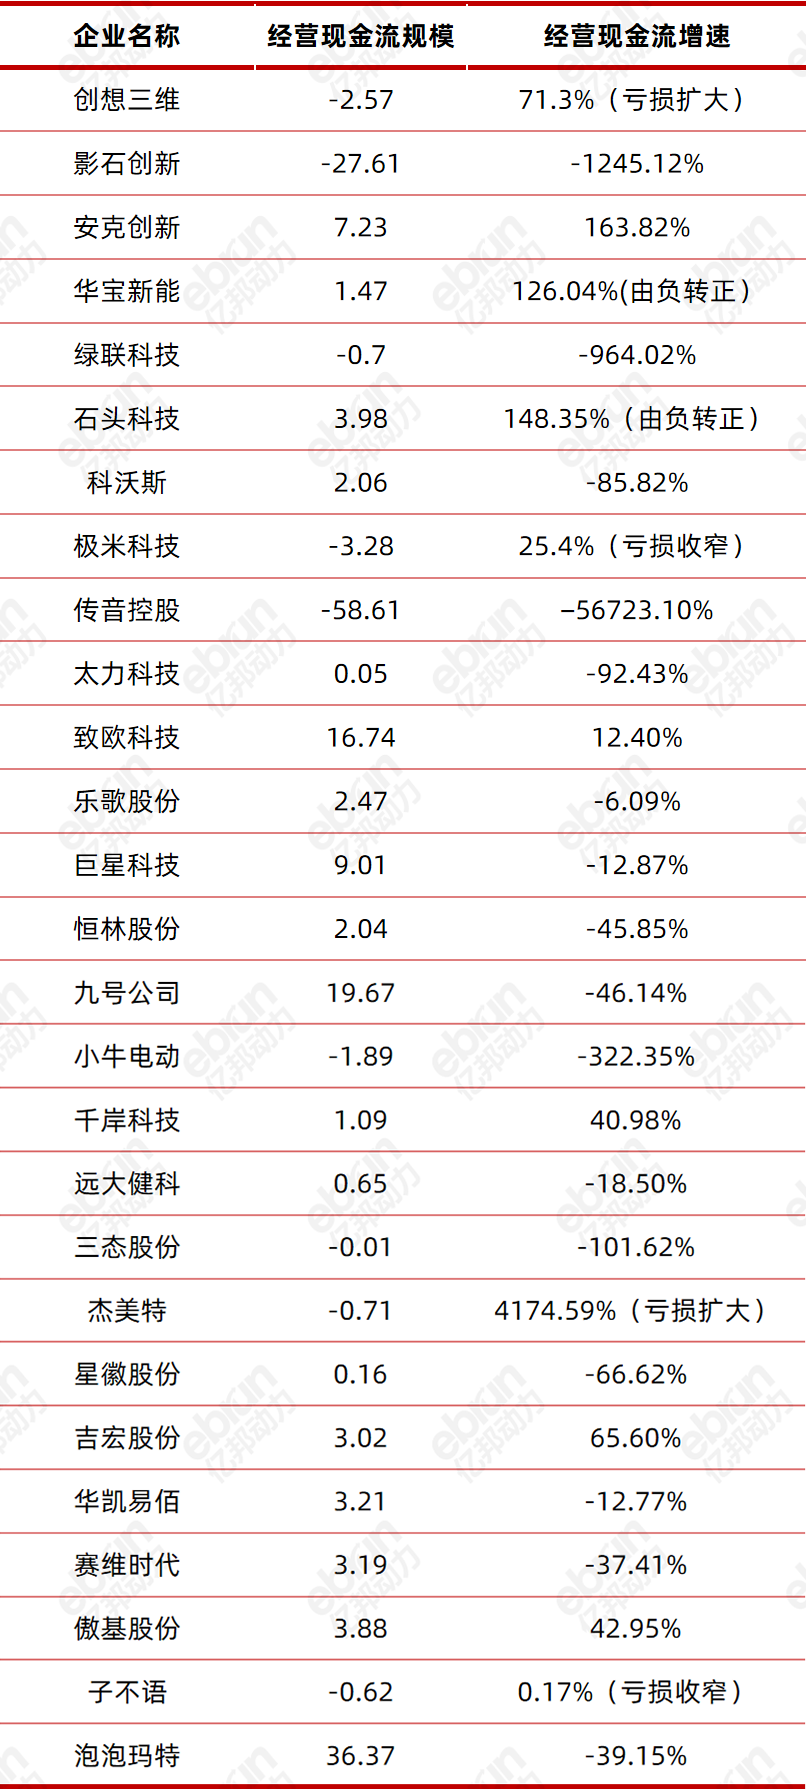
Shifting focus from revenue and profit data to cash flow statements, cost structures, and balance sheets can reveal a company's true foundation.
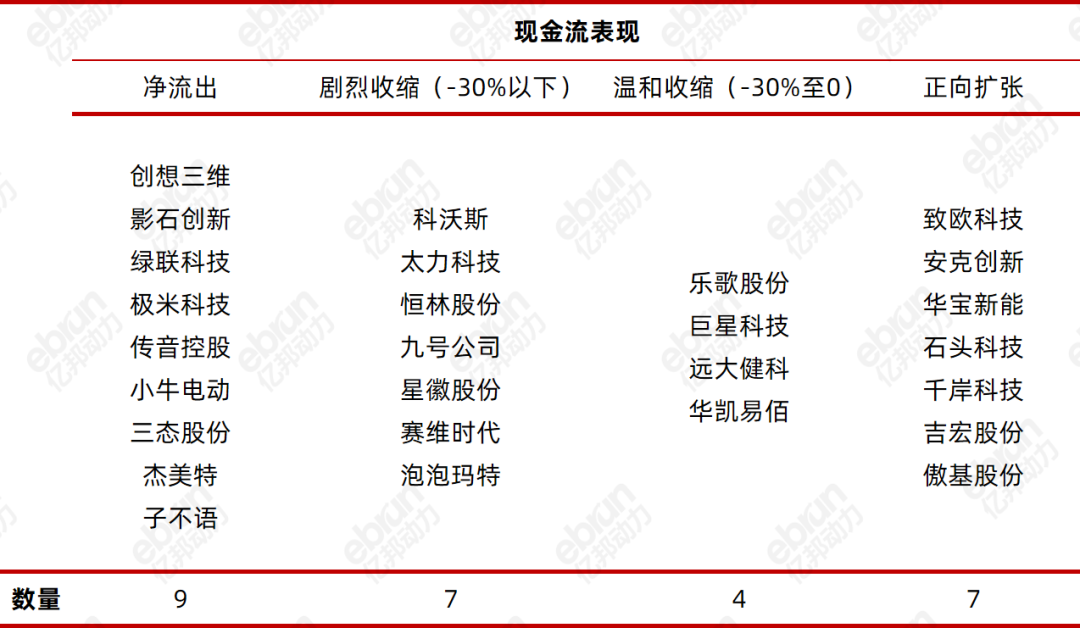
Among these, operating cash flow is the most critical "barometer," directly reflecting a company's self-sustaining capability. In the first half, of the 27 cross-border leaders, only 7 improved year-on-year, 11 contracted, and 9 reported net operating cash outflows—ranging from global brands to veteran volume-based sellers, though the underlying reasons differ.
The cash flow pressure on Ugreen, Insta360, and Transsion appears more like proactive "stockpiling and fortifying" for the future. All three significantly increased raw material and inventory reserves to hedge against recent price hikes in chips and memory. Insta360's memory chip procurement alone approached 2 billion yuan; Ugreen's inventory buildup absorbed approximately 468 million yuan in cash; Transsion, more aggressively, reported inventory close to 19 billion yuan by period-end.
For consumer electronics companies, pre-purchasing chips, memory, and structural components is standard practice. During high revenue growth phases, it's common for procurement cash to flow out first, with profits recognized later after product sales, and cash returning with a lag.
Conversely, the cash flow strain on traditional general-merchandise giants is more closely tied to persistently high accounts receivable during transition periods. For example, Sanstate's accounts receivable have risen for multiple consecutive quarters, constrained by e-commerce platform settlement cycles, while its logistics business also requires upfront capital, exacerbating financial pressure.
Among improving cash flows, Anker stands out. In the first half, it swung from negative to positive cash flow, surging 163.82% year-on-year, driven by net business cash inflows and receipt of tariff refunds.
Another notable star is Pop Mart. Six months ago, its cash flow had grown 125% year-on-year. Yet, just half a year later, that figure has declined nearly 40% year-on-year. This is linked to sustained investments required for overseas expansion. However, the company still has ample ammunition, with cash and cash equivalents hitting a massive 12.4 billion yuan at period-end.
If cash flow shows whether the "money bag" is full, then the cost structure shows whether money is "spent on the cutting edge."
In the first half, most companies continued to boost marketing spend, with 13 companies seeing selling expenses grow over 15%, averaging a 20.85% increase. Among them, Insta360, Taili Technology, and Henglin Co. saw selling expense growth exceed 50%. The logic varies: some are in peak new product launch cycles, requiring sustained promotion to create bestsellers; others are in OBM expansion phases, needing to enhance brand exposure and channels.
A positive shift is improved marketing ROI. In this round of half-year reports, 15 companies had revenue growth outpacing selling expense growth, exceeding half the sample; in the previous year-end review, this ratio was only about a quarter.
Compared to the broad rise in selling expenses, R&D investment is sharply divergent. Fourteen companies saw R&D expense growth exceed 10%, primarily in consumer electronics and smart hardware. Among them, Insta360, Anker, EcoFlow, Ugreen, and Ninebot posted growth rates above 40%. At the other extreme are "non-electronic traditional categories" like furniture and home goods, and general-merchandise giants, with several reporting R&D expense ratios below 1%, essentially forgoing new technology reserves.
Several "global first" heavyweight products were unveiled: Ugreen launched its next-gen AI agent hub, MasterAgent, supporting local operation of a 122B-parameter model with ultra-high computing power; EcoFlow introduced the world's first 100kWh home energy storage cabinet, expanding its target customer base from apartment dwellers to oversized residences; Creality rolled out a "desktop-grade filament production system," securing the top spot on Indiegogo for global 3D printing crowdfunding projects in the first half.
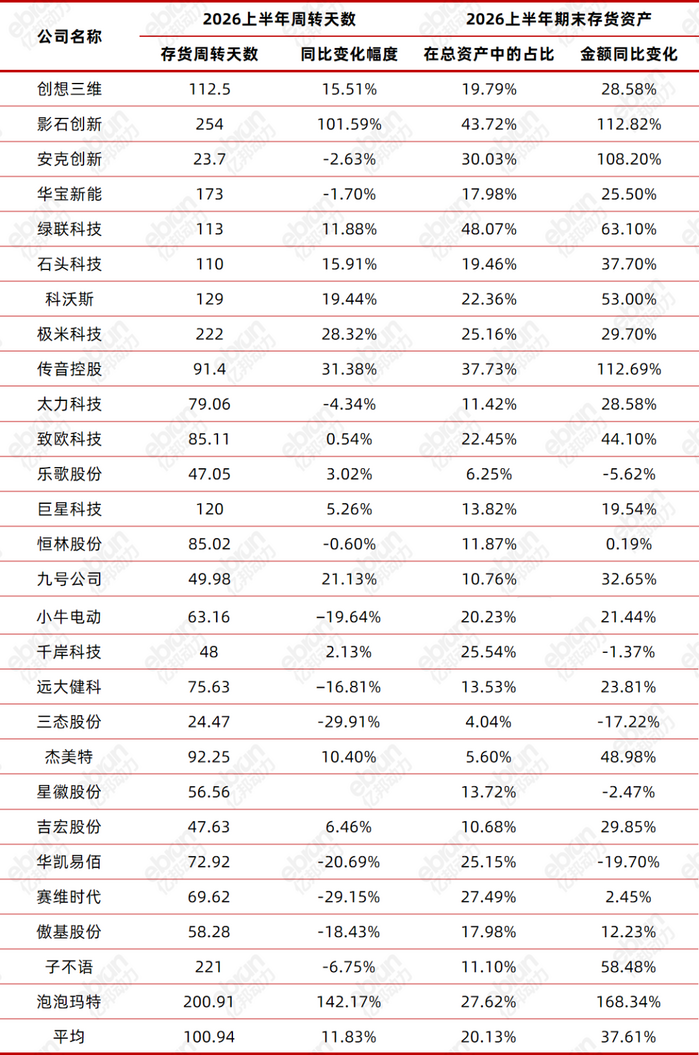
Additionally, the half-year reports revealed a widespread phenomenon: rapid inventory expansion with declining turnover efficiency.
Statistics show the industry's average inventory turnover days reached 101 days, up nearly 12% year-on-year; inventory as a share of total assets averaged over 20%, with inventory value up nearly 38% year-on-year. Over half of the companies saw turnover days lengthen, and 80% saw inventory values rise; 11 companies had inventory growth exceeding 30%, with four doubling.
Of course, inventory growth doesn't necessarily indicate deteriorating operations. Anker, for instance, isn't worried about slow-moving stock, with inventory turnover days at just 23.7 days, the fastest in the industry. For them, pre-stocking is a proactive strategy to "snap up raw materials at low prices" and "bet on strong year-end holiday sales." But for others, excessively long inventory turnover days paint a worrying picture.

Deepening Software Ecosystems, Accelerating Non-US Market Expansion
For many cross-border giants, product sales aren't the end. With expanding user bases, software ecosystems, user services, and operational capabilities centered on core businesses are becoming new incremental revenue streams. According to incomplete statistics from Ebrun, 9 of the 27 companies surveyed disclosed software service initiatives in their financial reports.
On one hand, many tech hardware companies are enriching application ecosystems and value-added services around core product usage scenarios.
For example, Creality is building a creator ecosystem platform around its 3D printers. The company disclosed that in the first half of 2026, Creality Cloud added over 1 million new registered users, up 77.1% year-on-year; monthly active users grew 68.3%, active creators surged 94.3%, and membership revenue rose 60.1%. It also launched Nexbie, an overseas e-commerce platform dedicated to 3D creative products, exploring monetization extension from hardware sales to content, community, and membership services.
Similarly, Insta360 is continuously refining its software ecosystem. For them, software services aren't just auxiliary tools but key entry points to connect users, boost repurchases, and extend product lifecycles. As of June 2026, Insta360's app monthly users grew 67% year-on-year, with user-exported file volumes up 126%; its cloud-based auto-editing feature "Moments Pro" achieved a 60% export rate, and cloud storage paying users increased over 124% year-on-year.
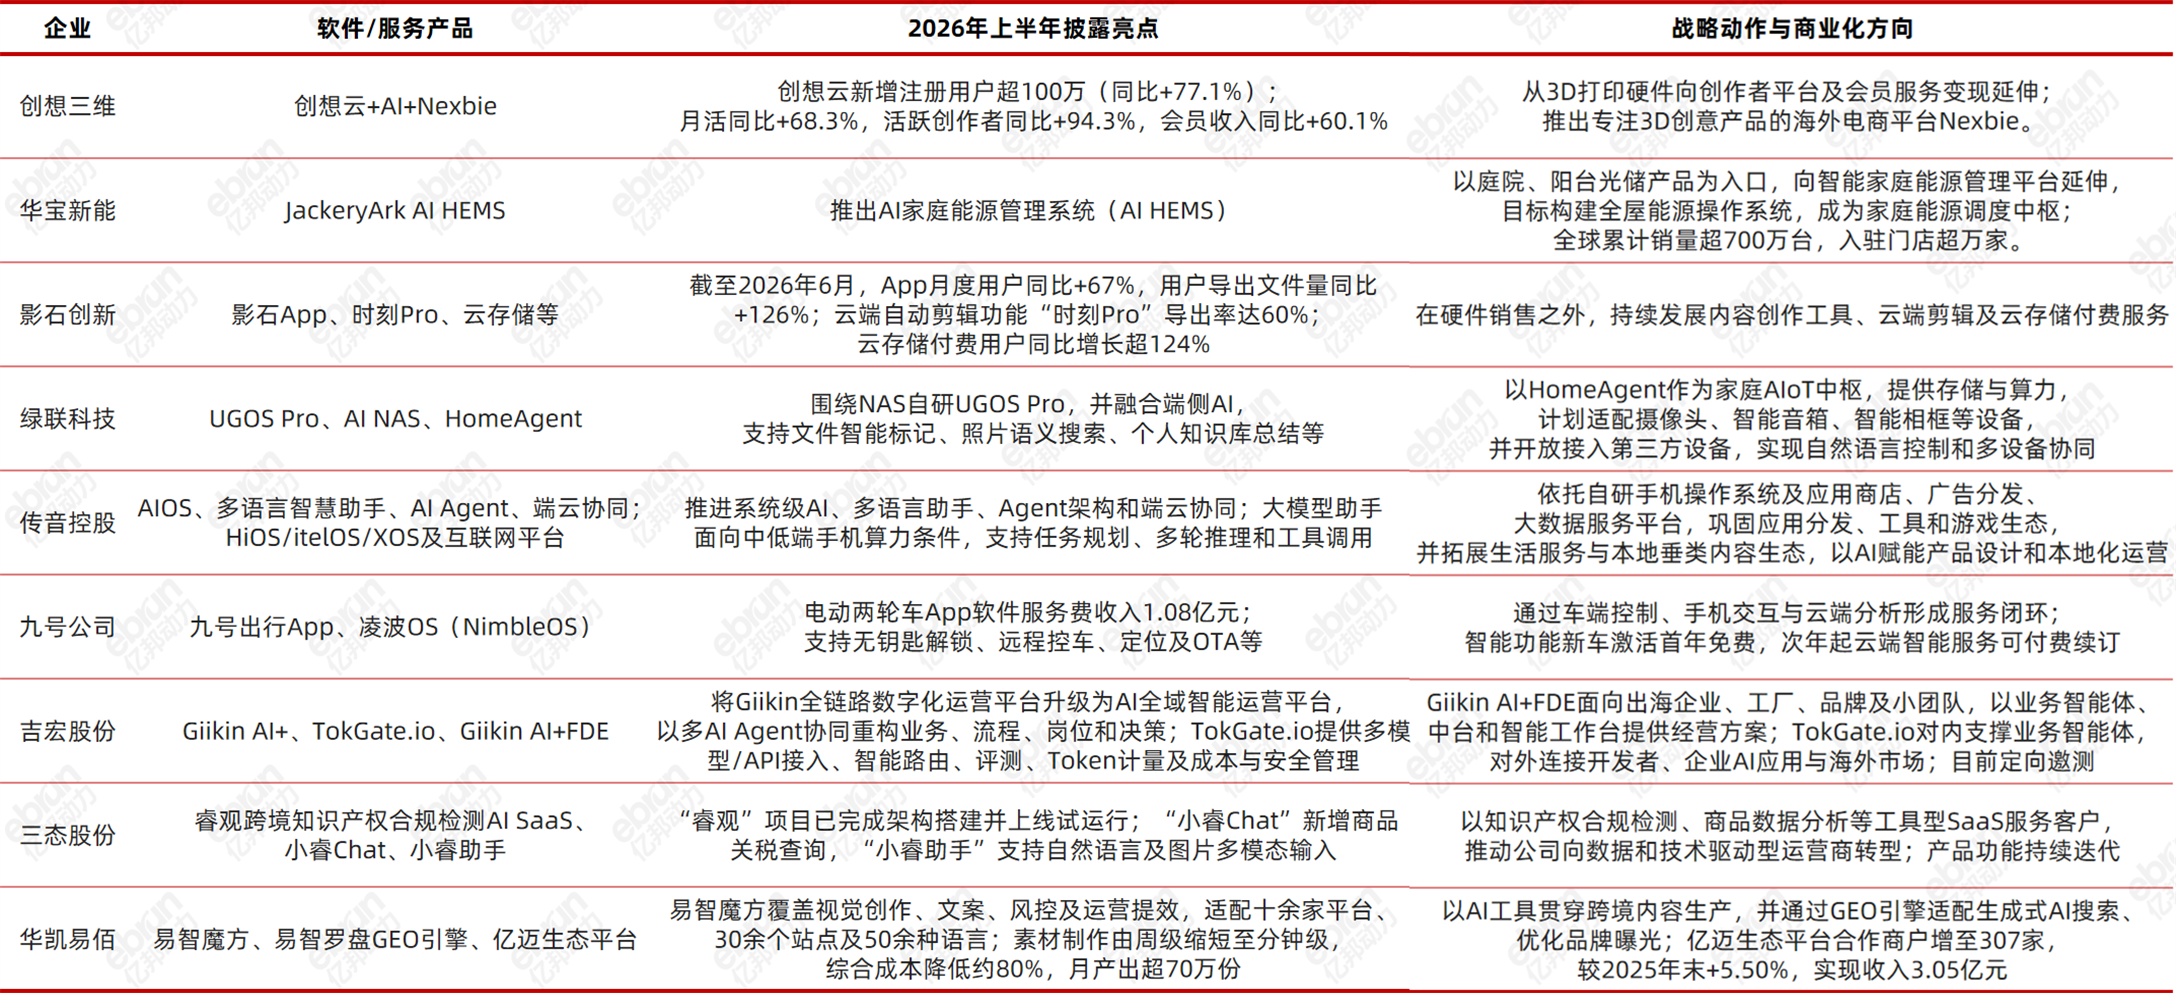
On the other hand, beyond tech brands extending into software ecosystems, some traditional giants like Jihong, Sanstate, and Hua Kai Yi Bai are beginning to productize and tool their years-accumulated operational expertise, serving external clients via SaaS and AI agents. Previously, capabilities like product selection, ad placement, inventory management, and supply chain coordination were hidden within internal operations. Today, as AI lowers software development barriers, these capabilities are gradually transforming into commercializable standard products.
Moreover, with intensifying competition in US and European markets, an increasing number of cross-border enterprises are turning to non-US markets—with Latin America standing out.
Anker has set up local operational teams in key countries like Brazil, partnering with regional e-commerce leaders like Mercado Libre to introduce advantageous categories and drive Latin American business. Zoyu Tech views Latin America as its "third growth engine," with revenue doubling in the region during the first half, and completing its first warehouse setup in Brazil. Sanstate also regards Mercado Libre as a new growth point, with revenue share from that platform rising to 9.20% in the first half of 2026, making it a key sales channel.
EcoFlow is focusing on Europe and Japan. Its European business saw explosive growth of 123.15%, reaching sales of 314 million yuan during the reporting period. In Japan, its brand Jackery recently received a Frost & Sullivan certification as "No.1 in sales volume and sales value for seven consecutive years in Japan," further affirming its penetration in the Asian market.
Ebrun continues to track and report on this intelligence. For more information related to this article, please scan the QR code to follow the author on WeChat.

This article was first published on Ebrun's official website.
[Copyright Notice] Ebrun advocates respecting and protecting intellectual property rights. Without permission, no one is allowed to copy, reproduce, or use the content of this website in any other way. If any copyright issues are found in the articles on this website, please provide copyright questions, identification, proof of copyright, contact information, etc. and send an email to run@ebrun.com. We will communicate and handle it in a timely manner.
Translated by AI. Feedback: run@ebrun.com