
Amazon Third-Party Sellers Generate $575 Billion in GMV, Number of Sellers with Over $100 Million in Annual Sales Grows to 235
Ebrun Exclusive, July 19th: Recently, e-commerce data analytics firm SmartScout released its 'Amazon Seller Statistics 2026' report, providing a statistical analysis of the seller ecosystem, market size, and sales performance on the Amazon platform.
The report indicates that as of 2025, Amazon has approximately 1.9 million active sellers globally. The total Gross Merchandise Volume (GMV) generated by third-party sellers for the year reached about $575 billion, accounting for roughly 69% of the platform's total GMV. This solidifies third-party sellers as the dominant force in Amazon's marketplace transactions.
Data shows that the number of global active sellers in 2025 was around 1.9 million, remaining essentially flat compared to 2024 but lower than the 2.4 million recorded in 2021. Concurrently, the influx of new sellers onto the platform continued to slow down. In 2025, approximately 165,000 new sellers joined, a 44% decrease from 2024, marking the lowest level in nearly a decade.
Despite the reduction in the number of active sellers, the platform traffic captured by individual sellers has increased. SmartScout estimates that since 2021, the average traffic per active seller has grown by about 31%, suggesting sellers who remain on the platform can reach a larger consumer base.
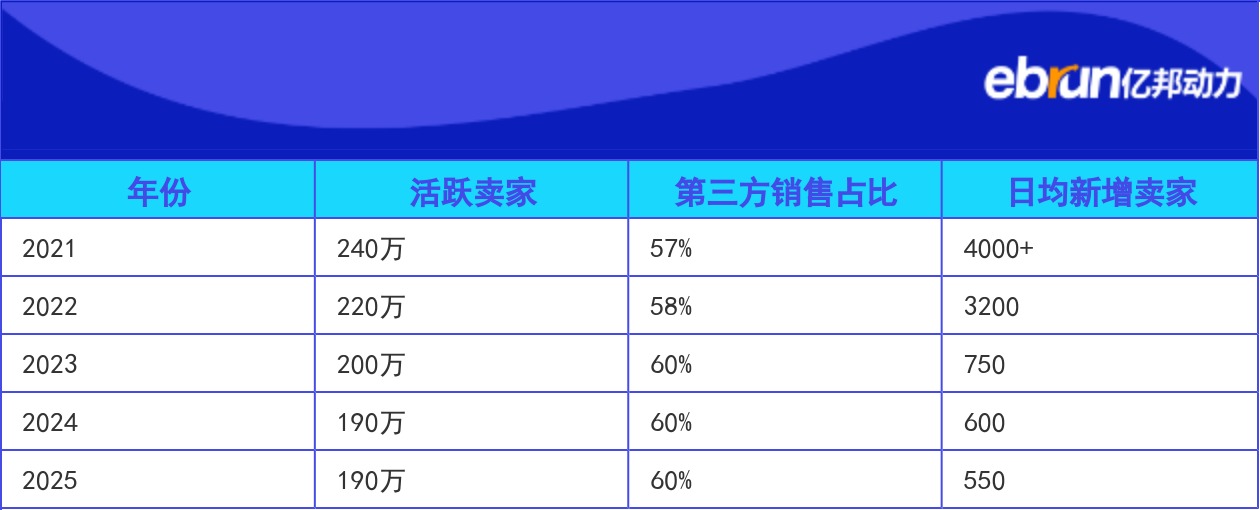
The report also disclosed the changes in the number of Amazon's active sellers in recent years:
| Year | Active Sellers | Third-party Sales Share | Avg. Daily New Sellers |
| 2021 | 2.4M | 57% | 4000 |
| 2022 | 2.2M | 58% | 3200 |
| 2023 | 2.0M | 60% | 750 |
| 2024 | 1.9M | 60% | 600 |
| 2025 | 1.9M | 60% | 550 |
Regarding seller sales scale, the report estimates that over 100,000 Amazon sellers now have annual sales exceeding $1 million, nearly double the figure from 2021. Among them, the number of sellers with annual sales surpassing $100 million has increased to 235, compared to only about 50 four years ago. Meanwhile, Amazon's official '2025 Small Business Empowerment Report' previously showed that over 75,000 independent sellers achieved annual sales of more than $1 million in 2025, representing a 36% year-over-year growth.
From a geographic distribution perspective, the United States remains the country with the highest number of Amazon sellers, accounting for 37.82% of all registered sellers. Chinese sellers continue to hold a significant market share, contributing approximately 35.1% of third-party seller sales revenue. Sellers from the United Kingdom make up about 9.54% of the global seller total.
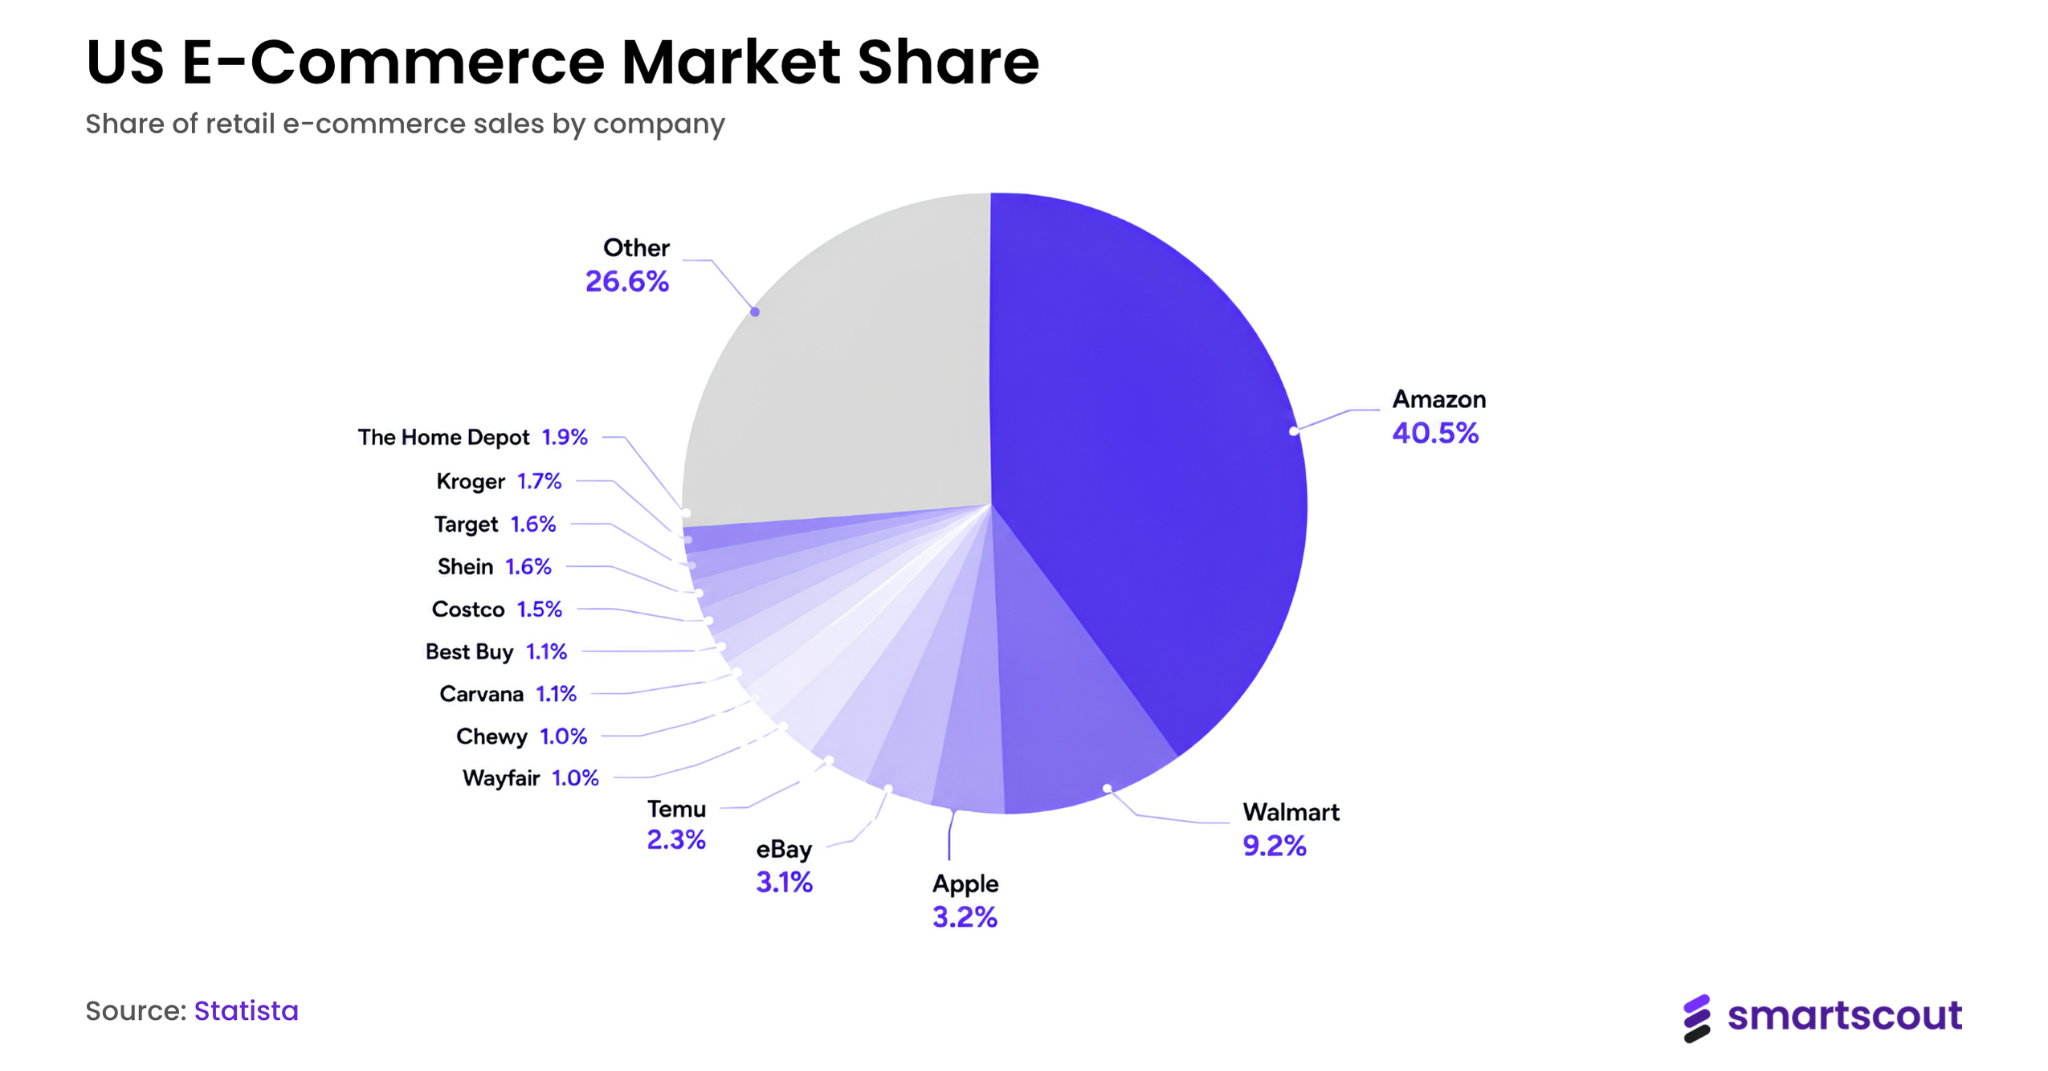
In terms of platform scale, SmartScout data shows that Amazon currently holds a 40.5% share of the U.S. retail e-commerce market, maintaining its industry leadership position. Walmart follows in second place with a 9.2% market share.
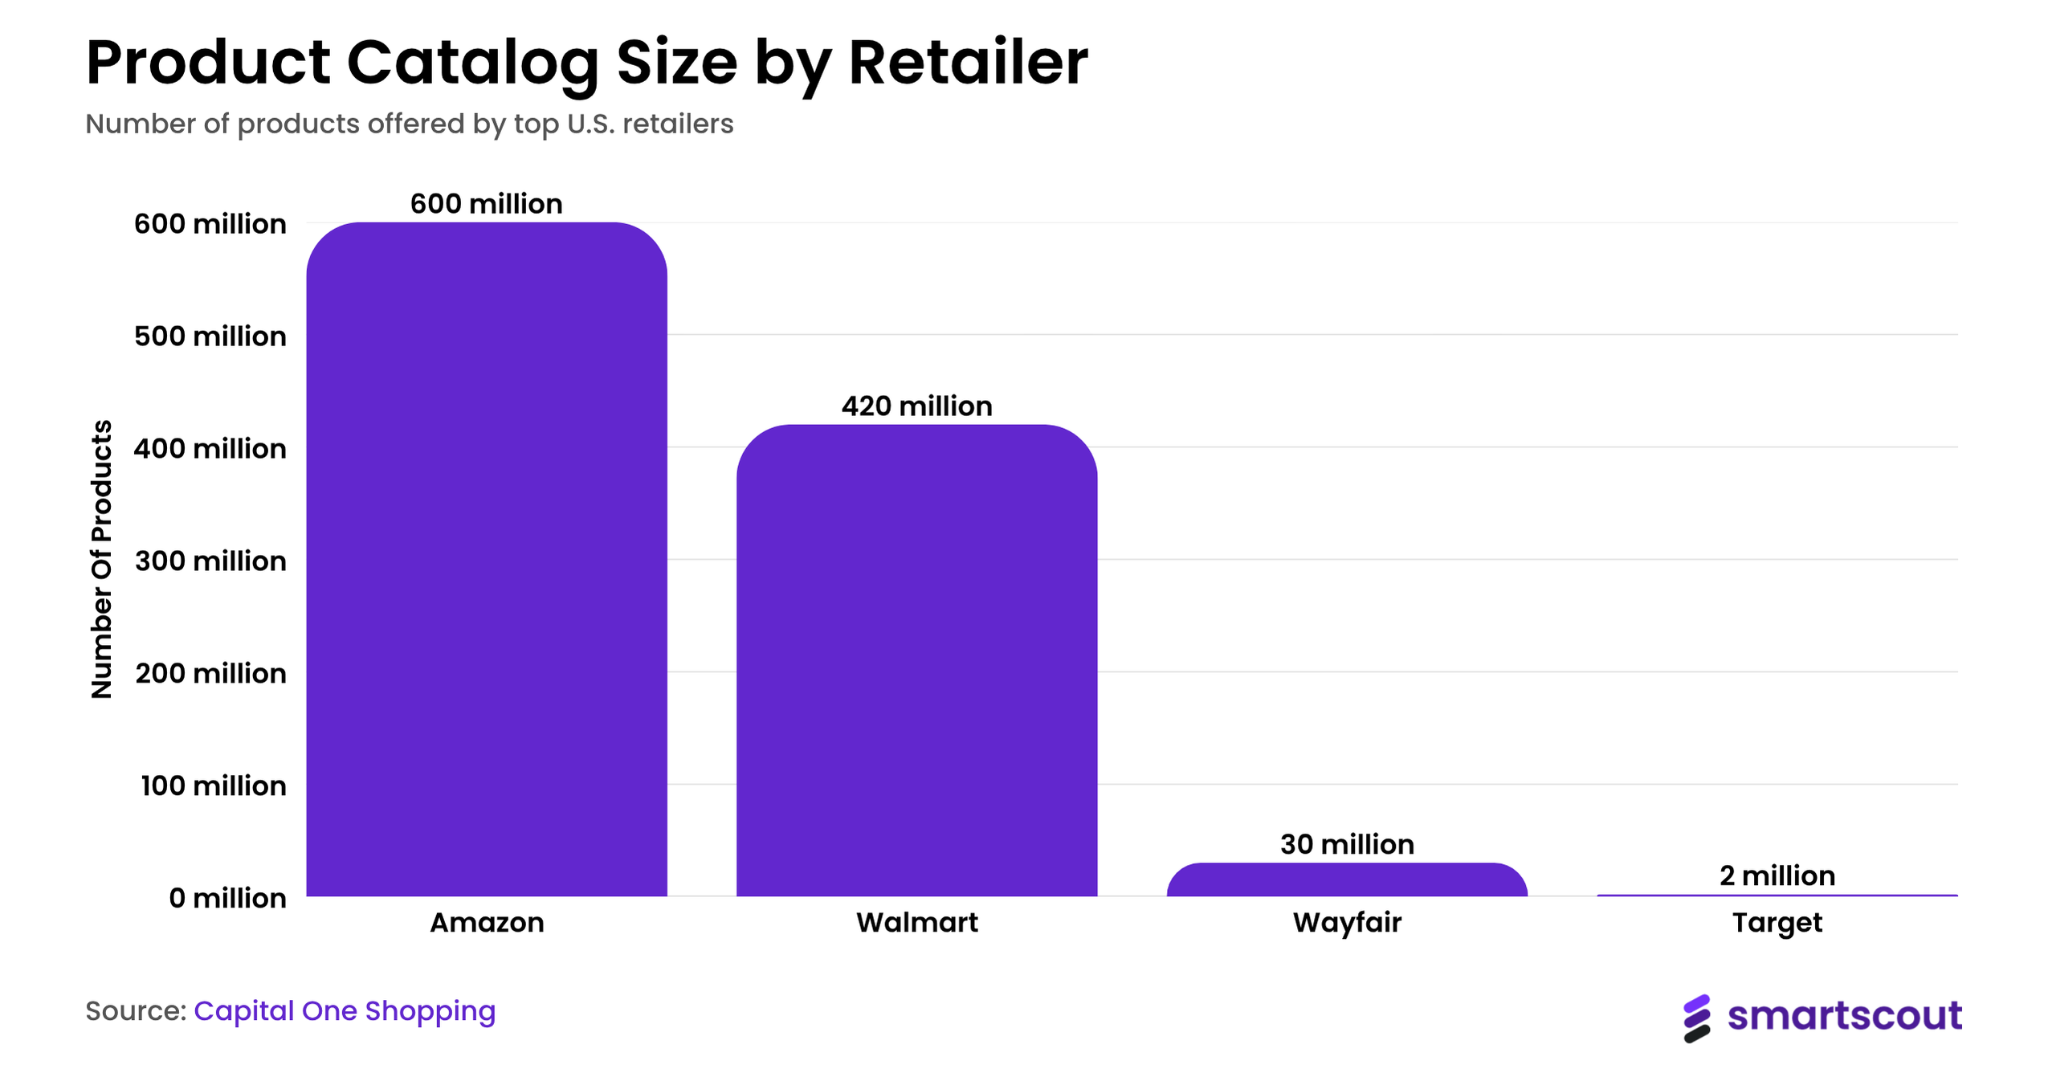
The report also points out that Amazon's global marketplaces currently host approximately 600 million products, far exceeding platforms like Walmart, Wayfair, and Target.
Among these, about 12 million are Amazon's own retail products, while the remaining over 588 million come from third-party sellers, constituting 97.9% of the total product catalog. Compared to the roughly 350 million products in 2019, the growth in platform product count in recent years has almost entirely come from third-party sellers, not Amazon's retail business.
Regarding traffic, Amazon.com receives about 2.6 billion visits per month, making it the most visited e-commerce website globally. Over 86% of this traffic originates from the U.S. market, with users spending an average of 5 minutes and 54 seconds per visit.
The report estimates that Amazon now has over 310 million active global users and a Prime membership base exceeding 230 million. Survey data indicates that 73% of consumers cite fast, free shipping as the primary reason for choosing to shop on Amazon.
As the scale of third-party sellers continues to expand, their share of platform transactions has further increased.
SmartScout estimates that in 2025, third-party seller GMV was approximately $575 billion, accounting for about 69% of Amazon Marketplace's total GMV, up from 60% in 2019. By units sold, third-party sellers contributed to 61% of the total number of items sold on the platform in Q4 2025.
Notably, VEVOR became the only Chinese cross-border enterprise to enter the top ten list of brands by monthly sales on Amazon.
Artificial intelligence tools are gradually permeating seller operations.
The report states that as of 2025, about 900,000 sellers use AI tools to generate or optimize product listings, reducing the time to create a single product page from roughly 4 hours in the past to 30-45 minutes. Meanwhile, by Q3 2025, approximately 1.3 million sellers were using the generative AI product listing tool officially launched by Amazon.
In terms of product categories, Health & Household and Home & Kitchen are Amazon's two highest-grossing categories, with monthly sales reaching $4.44 billion and $4.23 billion, respectively. The combined monthly sales of the top ten categories exceed $27 billion.
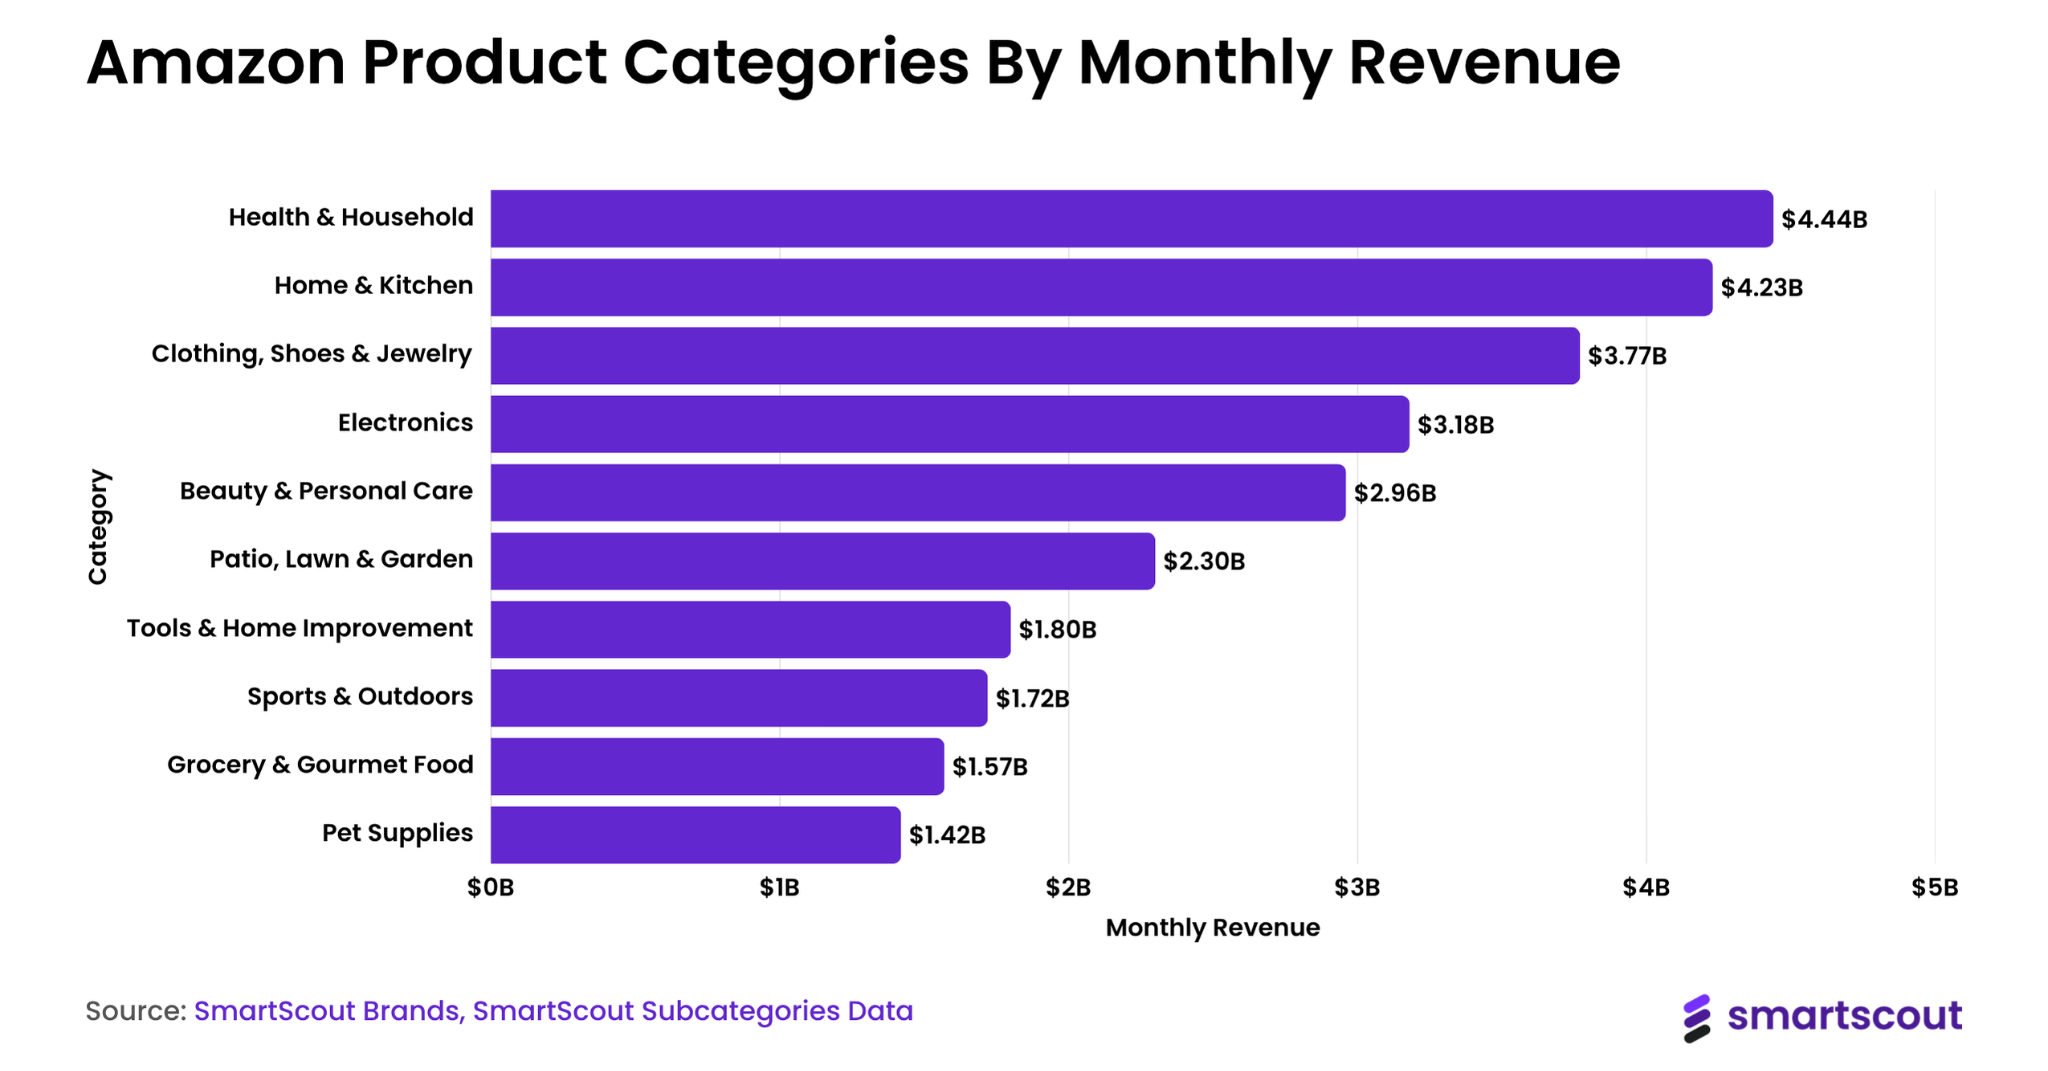
The Home & Kitchen category alone hosts over 100,000 brands and is also the most competitive, with an average of 445 sellers per listing.
Regarding logistics services, approximately 82% of active sellers now utilize the Fulfillment by Amazon (FBA) model, an increase from the roughly 50% penetration rate in 2019.
The report estimates that after accounting for platform commission fees, FBA fulfillment fees, storage fees, and advertising costs, FBA sellers, on average, need to allocate 30% to 35% of their revenue to Amazon. After deducting product costs, the average net profit margin is about 15% to 20%, with around 64% of FBA sellers achieving profitability within 12 months of operation.
Ebrun will continue to track and report on this information. To learn more details related to this article, please scan the QR code to follow the author's WeChat.

[Copyright Notice] Ebrun advocates respecting and protecting intellectual property rights. Without permission, no one is allowed to copy, reproduce, or use the content of this website in any other way. If any copyright issues are found in the articles on this website, please provide copyright questions, identification, proof of copyright, contact information, etc. and send an email to run@ebrun.com. We will communicate and handle it in a timely manner.
Translated by AI. Feedback: run@ebrun.com